Trajectory Grouping Structure
To see if our model of the grouping structure is practical and indeed captures the grouping behavior of entities we implemented our algorithms and generated videos showing all maximal groups. The videos can, for example, be opened using VLC.
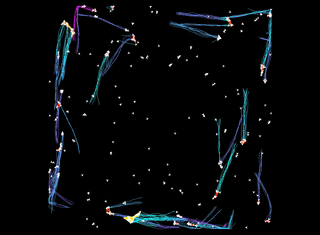
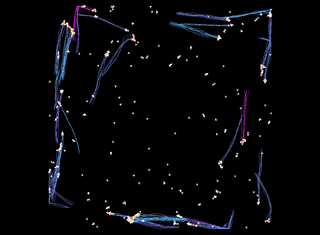
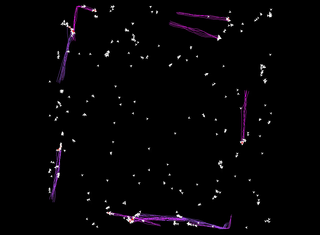
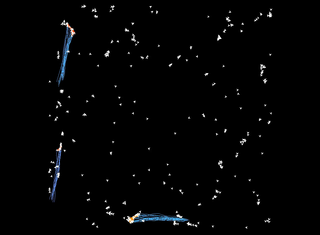
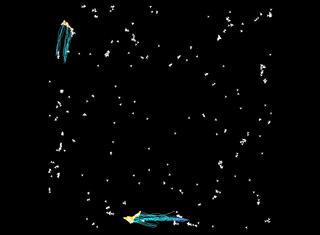
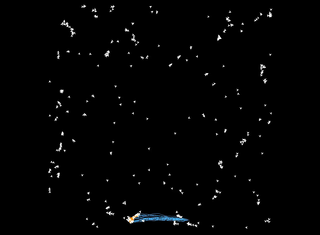
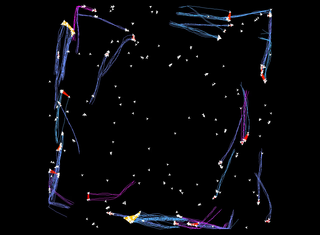
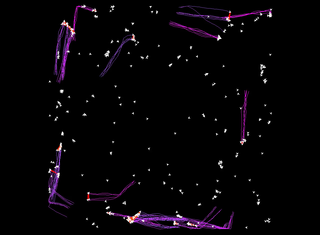
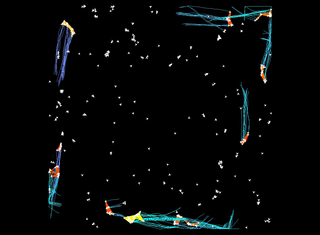
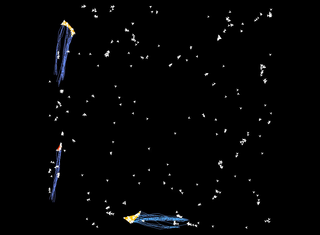
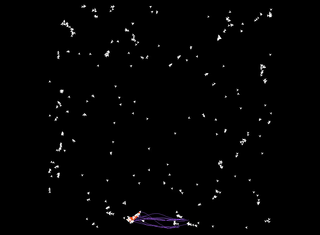
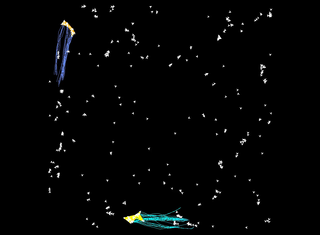
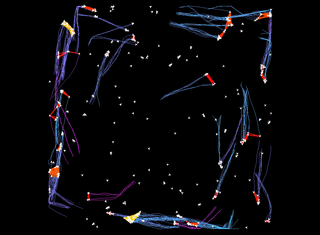
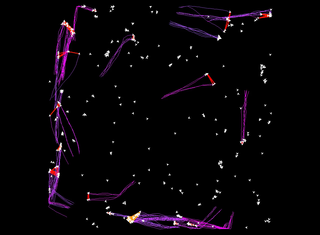
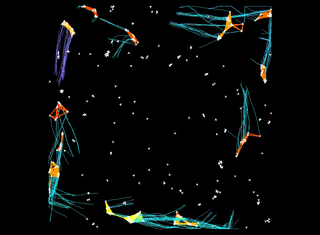
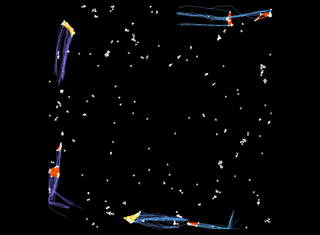
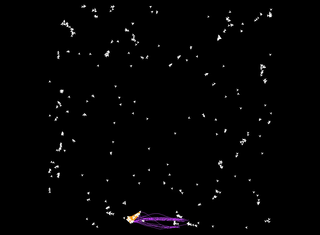
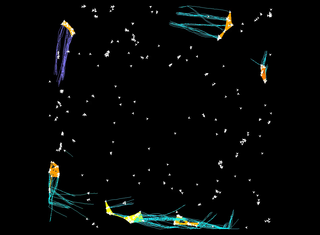
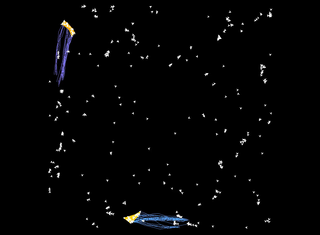
Entities of the same group that are within distance $2\epsilon$, i.e. the entities that are directly connected, are connected by an line segment. The color of this line segment indicates the size of the group. The color ranges from red, for small groups (4 entities), to yellow for large groups (30 entities or more).
When an entity is part of a group it leaves a colored ``tail''. This tail indicates the duration of the group. The color ranges from cyan, for short groups (length 40), to purple for long groups (length 275 or more). To avoid cluttering the diagram the tails have a maximum length of 30, so at any time $t$ they at most show the trajectory from $t - 30$ to $t$. When a group ends, the tail immediately disappears.
Netlogo
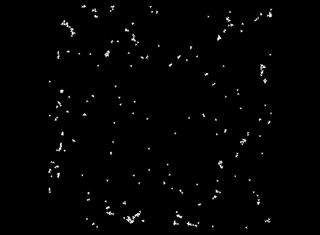
We generated several data sets using an adapted version of the NetLogo Flocking model. In our adapted model the entities no longer wrap around the world border, but instead start to turn when they approach the border. Furthermore, we allow small random direction changes for the entities. The data set that we consider here contains 400 trajectories, with 818 vertices each. Our videos show all maximal groups for varying parameter values.
$\varepsilon = 3$
| $\delta = 40$ | $\delta = 100$ | $\delta = 200$ | |
| $m = 4$ |
|
|
|
| $m = 10$ |
|
|

|
| $m = 17$ |
|
|

|
$\varepsilon = 5.25$
| $\delta = 40$ | $\delta = 100$ | $\delta = 200$ | |
| $m = 4$ |
|
|
|
| $m = 10$ |
|
|
|
| $m = 17$ |
|

|
|
$\varepsilon = 7.5$
| $\delta = 40$ | $\delta = 100$ | $\delta = 200$ | |
| $m = 4$ |
|
|
|
| $m = 10$ |
|
|
|
| $m = 17$ |
|
|

|
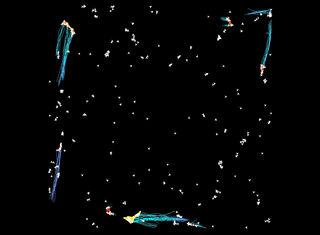
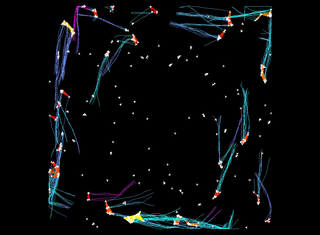
Starkey
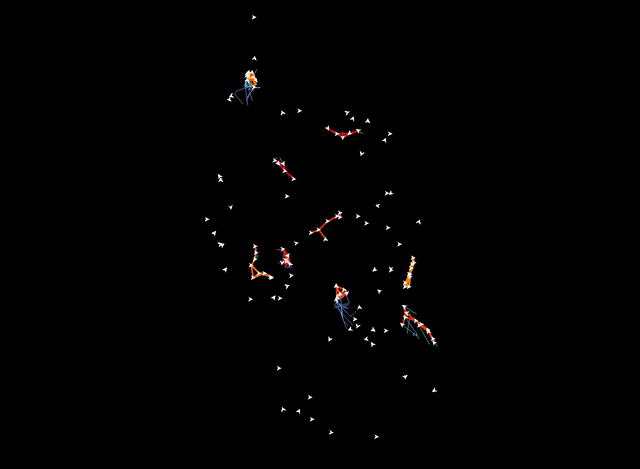
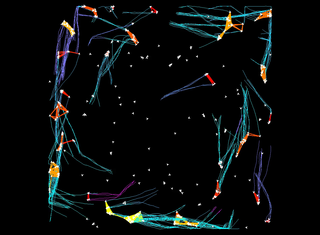
We use tracking data obtained in the Starkey project. This data set captures the movement of deer, elk, and cattle in Starkey, a large forest area in Oregon (US) over three years. Not all animals are tracked during the entire period, and positions are not reported synchronously for all entities. Thus, we consider only a subset of the data, and resample the data such that all trajectories have vertices at the same (regularly spaced) times. We chose a period of 30 days for which we have the locations of most of the animals. This yields a data set containing 126 trajectories with 1264 vertices each.
We use the same visualization as before. The size color scale ranges from 5 (red) to 15 (yellow). The duration color scale ranges from 15 000 seconds (cyan) to 80 000 seconds (purple).